Data Handling and Presentation Class 6 Maths Chapter 4 Notes PDF (PDF · 14 pages · ₹49) Unlock the full PDF for ₹49
Free sample: pages 1 to 3 of 14. The full PDF costs ₹49.
Why does a poster showing Mount Everest "twice as tall" as Mount Elbrus tell a small lie? Because 5642 × 2 = 11,284 m, and Everest is only 8848 m. Spotting tricks like this is one of the skills in Data Handling and Presentation, Class 6 Maths Chapter 4, and these CBSE Class 6 Maths notes build them step by step, from tally marks to honest bar graphs.
This is a 14-page premium PDF of Chapter Notes for Class 6 Mathematics, Chapter 4 of the NCERT textbook Ganita Prakash, for CBSE 2026-27. It costs ₹49. The notes are NCERT based revision notes written in simple language with colourful graphs, worked examples and a one-page summary. This is independent study material prepared by our team; it is not an official CBSE or NCERT publication.
Class 6 Maths Chapter 4 Data Handling and Presentation Notes: What Is Included
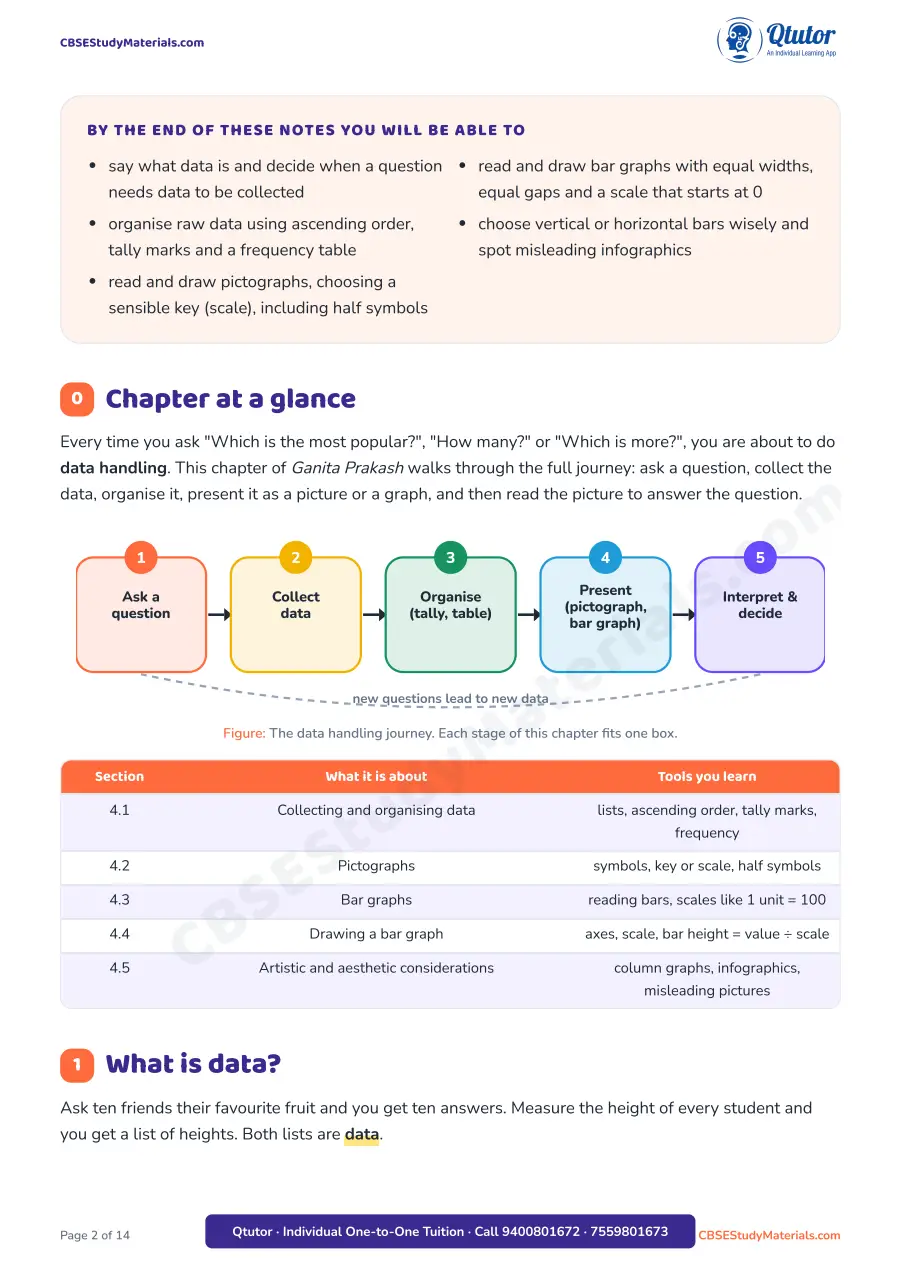
- Chapter at a glance: a five-step picture of the data handling journey (ask, collect, organise, present, interpret) and a table linking each step to Sections 4.1 to 4.5
- What is data: a clear definition, everyday examples and a table that sorts questions into "needs data" and "just a fact"
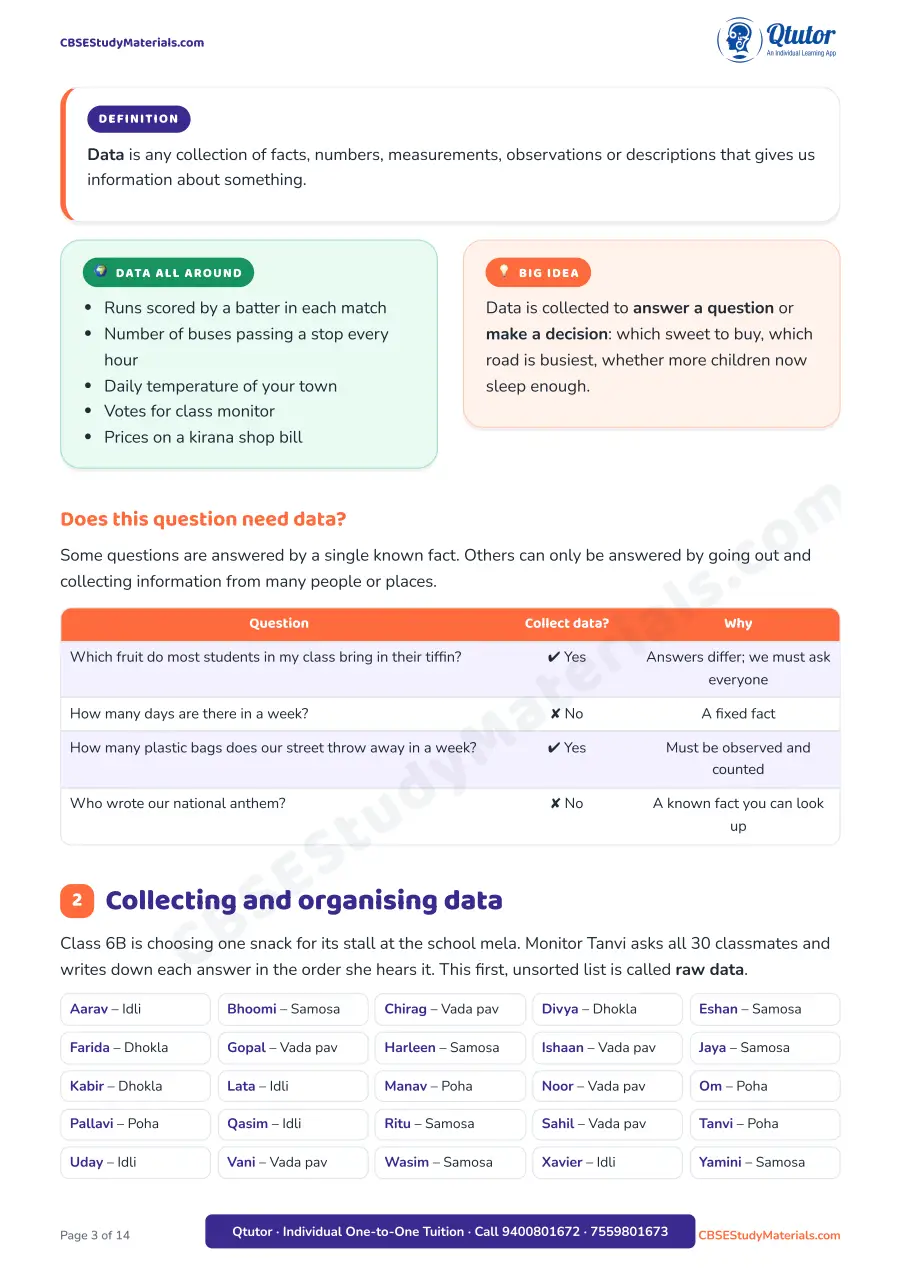
- Collecting and organising data: a 30-student snack survey taken from raw list to tally marks to a frequency table, plus a quiz-score example arranged in ascending order
- Pictographs: a mango-sales pictograph with half symbols, four steps for drawing one, and a table showing how the choice of key changes the picture
- Bar graphs: a labelled diagram of the six parts of a good bar graph and a worked reading example on plastic bottles collected by five sections
- Drawing a bar graph: a full worked example (science-fair visitors) showing how to choose the scale, find each bar height (value ÷ scale) and draw the graph
- Artistic and aesthetic considerations: vertical versus horizontal bars, a column graph of the tallest mountain on each continent, and a triangle infographic that shows how pictures can mislead
- Common mistakes, Did you know and Think deeper cards throughout
- Key terms grid with 12 terms, a mind map, 12 Check yourself questions with a compact answer key, and a one-page summary at the end
Structure of the PDF
| Part | What you get | Pages |
|---|---|---|
| Cover, objectives, chapter at a glance | Learning goals and the data handling cycle | 1-2 |
| Sections 1-3 | Data, organising data, pictographs | 2-7 |
| Sections 4-5 | Reading and drawing bar graphs | 7-9 |
| Section 6 | Column graphs, infographics, misleading pictures | 9-11 |
| Key terms and mind map | 12 terms, one-page mind map | 11-12 |
| Check yourself and summary | 12 questions, answer key, one-page summary | 13-14 |
Data Handling and Presentation Class 6 Important Topics
- Meaning of data and when a question needs data to be collected
- Raw data, ascending order and why sorting helps
- Tally marks in bundles of five and frequency tables
- Frequency, and checking that frequencies add up to the total
- Pictographs: symbols, the key or scale, half symbols, and when a key does not fit (values like 33 or 27 with a key of 10)
- Bar graphs: equal widths, equal gaps, scales such as 1 unit = 30 visitors, and why the scale must start at 0
- Choosing a scale from the smallest and largest values
- Vertical bars (column graphs) for heights and horizontal bars for lengths
- Infographics and how fancy pictures can mislead
Data Handling and Presentation Class 6 Important Questions (Sample)
A few of the 12 Check yourself questions from the notes:
- A pictograph has the key 1 symbol = 8 books. One row shows 4 full symbols and a half symbol. How many books is that? (Answer: 4 × 8 + 4 = 36 books.)
- A marks graph starts its vertical axis at 60. Rahul's bar (90 marks) looks three times as tall as Seema's (70 marks). Is Rahul's score three times Seema's? (No: from 60 the bars are 30 and 10, but 90 is only 20 more than 70. The axis must start at 0.)
- A frequency table shows 0 pets: 5 students, 1 pet: 8, 2 pets: 4, 3 pets: 3. How many pets do they own altogether? (Answer: 0 × 5 + 1 × 8 + 2 × 4 + 3 × 3 = 25.)
Here is how the notes work out bar heights for the science-fair example with the scale 1 unit = 30 visitors:
| Day | Mon | Tue | Wed | Thu | Fri |
|---|---|---|---|---|---|
| Visitors | 120 | 180 | 90 | 240 | 300 |
| Bar height (units) | 4 | 6 | 3 | 8 | 10 |
How These Notes Help
The chapter summary and diagrams turn a chapter full of tables and pictures into a few clear rules: tally in fives, state the key, keep widths equal, start the scale at 0, and always check the numbers behind a pretty picture. Each idea is followed by a worked example, so students can see the method before they practise it. The common-mistakes cards point out the errors teachers see most often, such as unequal steps on an axis or adding 0 + 1 + 2 + 3 instead of multiplying each value by its frequency. The one-page summary works as a last-minute revision sheet before a class test.
Who Should Use It
- Class 6 CBSE students studying Ganita Prakash who want clear revision notes for Chapter 4
- Students who find it hard to choose a scale or read half symbols in a pictograph
- Parents and tutors who want a short, reliable chapter summary with worked examples
- Teachers looking for ready graphs and a mind map for classroom revision
How to Download the Class 6 Data Handling and Presentation Notes PDF
Use the button below to get the 14-page premium PDF download (₹49). It opens on phone, tablet or computer and prints cleanly on A4.
Data Handling and Presentation Class 6 Maths Chapter 4 Notes PDF (PDF · 14 pages · ₹49)
Related Resources
- Class 6 Maths Chapter 4 Data Handling and Presentation NCERT Solutions: every Figure it Out and in-text question solved in textbook order
- Class 6 Maths Chapter 4 Data Handling and Presentation Question Bank: important questions with answers for practice
- Data Handling and Presentation Class 6 chapter page
- All Class 6 Mathematics study material
- Previous chapter: Class 6 Maths Chapter 3 Number Play
- Next chapter: Class 6 Maths Chapter 5 Prime Time
FAQs on Class 6 Maths Chapter 4 Data Handling and Presentation
Where can I download Class 6 Maths Chapter 4 Data Handling and Presentation notes PDF? You can download it from this page using the download button. It is a 14-page premium PDF priced at ₹49.
What are the important topics in Data Handling and Presentation Class 6? Data and its collection, tally marks and frequency tables, pictographs with a key, reading and drawing bar graphs, choosing a scale, and how infographics can mislead.
What is the price of the Data Handling and Presentation Class 6 notes PDF? It is a premium PDF that costs ₹49. It includes diagrams, a mind map, 12 practice questions with answers and a one-page summary.
Which book is Data Handling and Presentation Class 6 from? It is Chapter 4 of the NCERT Class 6 Mathematics textbook Ganita Prakash, used in CBSE schools for 2026-27.
Do the notes explain how to choose a scale for a bar graph? Yes. A worked example shows how to look at the smallest and largest values, pick a scale such as 1 unit = 30, and work out each bar height as value ÷ scale.
Is this an official NCERT notes PDF? No. It is independent study material prepared from the NCERT textbook by our team. It is not published by CBSE or NCERT.
Study tip: whenever you see a graph in a newspaper this week, check where its scale starts and whether all bars have the same width.